Are We Still In A Crypto Bull Market?
Analysts Rely Solely On Technical Analysis And Ignore Possible Biases
Warren Buffett once said that it is wise for investors to be “fearful when others are greedy, and greedy when others are fearful.” There is also a reason trading platforms often say “past performance is not an indication of future results.”
While many crypto influencers are great at technical analysis (TA), no one knows what will happen in the future, as TA is a lagging indicator.
Big institutions do TA, but they also have a whole host of other tools to support TA. With this in mind, analysts argue there is symmetry within the market cycles. Hence, they emphasise comparing past market behaviours and extrapolating to predict future behaviour.
Bitcoin’s Head And Shoulders Pattern Ignored
Many analysts predict this cycle to be a double peak cycle. These analysts predict Bitcoin surpassing its current all-time high (ATH) of nearly $65,000 to reach the lower end of six figures.
With the so-called ‘Moon Boys’ of crypto Youtube and Twitter calling for new ATHs so soon, one must ask a crucial question. “Why is no one talking about the head and shoulders (H&S) pattern on the Bitcoin chart?” (see Figure 1). Is this is a clear indicator of further downside?

According to Investopedia, market analysts believe the head and shoulders pattern to be one of the most reliable trend reversal patterns. It is one of several top patterns that signal that an upward trend will end. So why do almost all the bullish analysts on YouTube and Twitter ignore this pattern when making their predictions?
Bitcoin’s 53% Correction And Recent Bounce
Many in the crypto community may not want to hear anything negative, believing that this cycle’s bull run is not over yet. The more rational investors must be open to questions and counter-arguments. Retail crypto investors should be aware that YouTube and Twitter influencers make more money and increase follower count during market uptrends. Hence, whether they like it or not, these influencers are inherently biased in favour of sentiment favouring an uptrend.
While one only has four cycles to draw data from at a macro level, in these four cycles, Bitcoin has not returned to a bullish trend after more than a 50% correction. Perhaps this market cycle will be the first. After all, “past performance is not an indication of future results.”
According to CryptoWhale, a cryptocurrency analyst and…whale, during the 2018 BTC bear market, Bitcoin experienced several ‘pumps’ even as it spiralled into a bear market and the price fell. These pumps were in the region of 45%, 43%, 39%, 97%, 50%, 46% and 23% (see Figure 2). It is reasonable to assume that even as prices fell further and further, each pump sent a wave of renewed hope and bullishness across the market. Are we experiencing something similar with the recent pump in the price of Bitcoin? Could this recent bounce be a dead cat bounce? According to Investopedia, a dead cat bounce is “a temporary, short-lived recovery of asset prices from a prolonged decline or a bear market before the downtrend continuation. Frequently, downtrends are interrupted by brief periods of recovery — or small rallies — during which prices temporarily rise.”

Must Each Cycle Have A Blow-Off Top?
Given the ‘blow-off top’ pattern typical of a transition from market ATH towards a new bear market, investors and some analysts expected a similar pattern this cycle. One must ask oneself if Bitcoin’s increasing adoption means that such blow-off tops are a thing of the past. Unfortunately, there are not enough macro data points to support this theory. One will have to revisit this in the future. Benjamin Cowen is a crypto quant analyst known for his cardboard box tables and exceptional analysis. He posits a ‘possible’ lengthening cycle theory, which ‘could’ mean the market would experience a three- to six-month bear phase before the next leg up.
The lengthening cycle and diminishing return theories are all well and good. However, it has one wondering, what would a Bitcoin top look like with lengthening cycles? Perhaps a tapered top? A market cycle Doppler effect? (see Figure 3). After all, one cannot navigate the crypto market without a bit of dubious speculation.

Most Projects Have Seen All-Time Highs, But Not All.
Most investors assume that projects will reach their previous ATH in the previous bull cycle and then surpass it in the current cycle. There are instances where this has not happened. For example, Vertcoin, a Litecoin fork, has not even approached its 2018 ATH in this current cycle. Let us assume this cycle has reached its peak. In this case, projects that did not equal or surpass their previous ATH include Dash, EOS, Nano, Tron, and XRP.
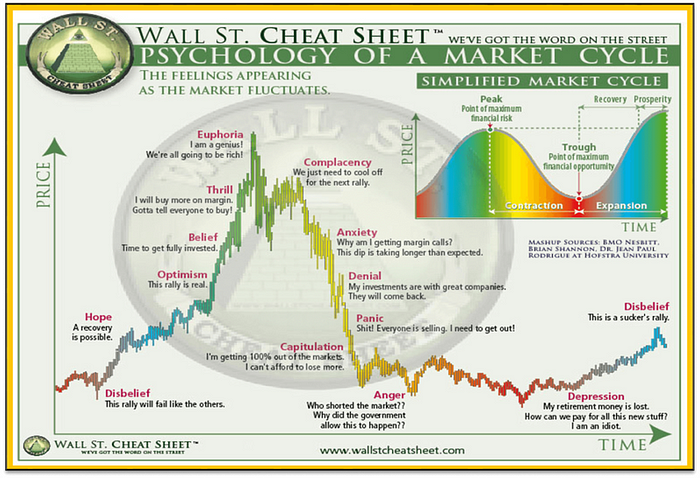
If we have already seen the cycle’s peak, we are currently experiencing a bull trap phase. Analysts and investors often look at the price of Dogecoin as a canary in a coal mine, signalling the flow of retail money into the crypto market and a sign of impending pump. Dogecoin has already made its call. Additionally, new and similar meme projects such as Shiba Inu and, dare one say, CUMROCKET have also made euphoric price pumps. These thousand per cent ROIs signalled a possible euphoria phase (see Figure 4). We are currently at the complacency stage if this argument holds water, similar to a bull trap stage on loose inspection.
Another argument favouring BTC having already topped is that most strong projects have already seen extreme ROIs (see Figure 5). Projects like Uniswap and Polygon have already seen ROI multiples of 107 and 223 within 52 weeks. One must then ask oneself: “Is 107 and 223 not enough, or does one require 1000 and 2000 to convince one that the market has peaked?” Remember the saying “fearful when others are greedy, and greedy when others are fearful.”

Timing The Market Versus ‘Time In’ The Market
We are possibly experiencing a ‘Dead Cat’ bounce corresponding to the ‘Complacency’ phase in market psychology. Experienced traders take advantage of these market dynamics, making a profit regardless. Nevertheless, one should bear in mind that 75% to 95% of traders lose money statistically speaking.
Market analysts suggest a BTC price target of around $50K in this pump. Ignoring intermediate resistance and support levels, a $50k target does not necessarily suggest the bull run is back on, and we could see a retest of the downward trendline. Suppose this retest does occur and holds as support. In that case, some traders may use this opportunity to take up positions and take profit on a bounce. This analysis is highly speculative, in any case (see Figure 6).

Take care, fellow crypto travellers. Remember to have a strategy, take profits incrementally and fight the feeling of FOMO. When one train leaves the station, another will arrive to take one to financial freedom.